
Inspector
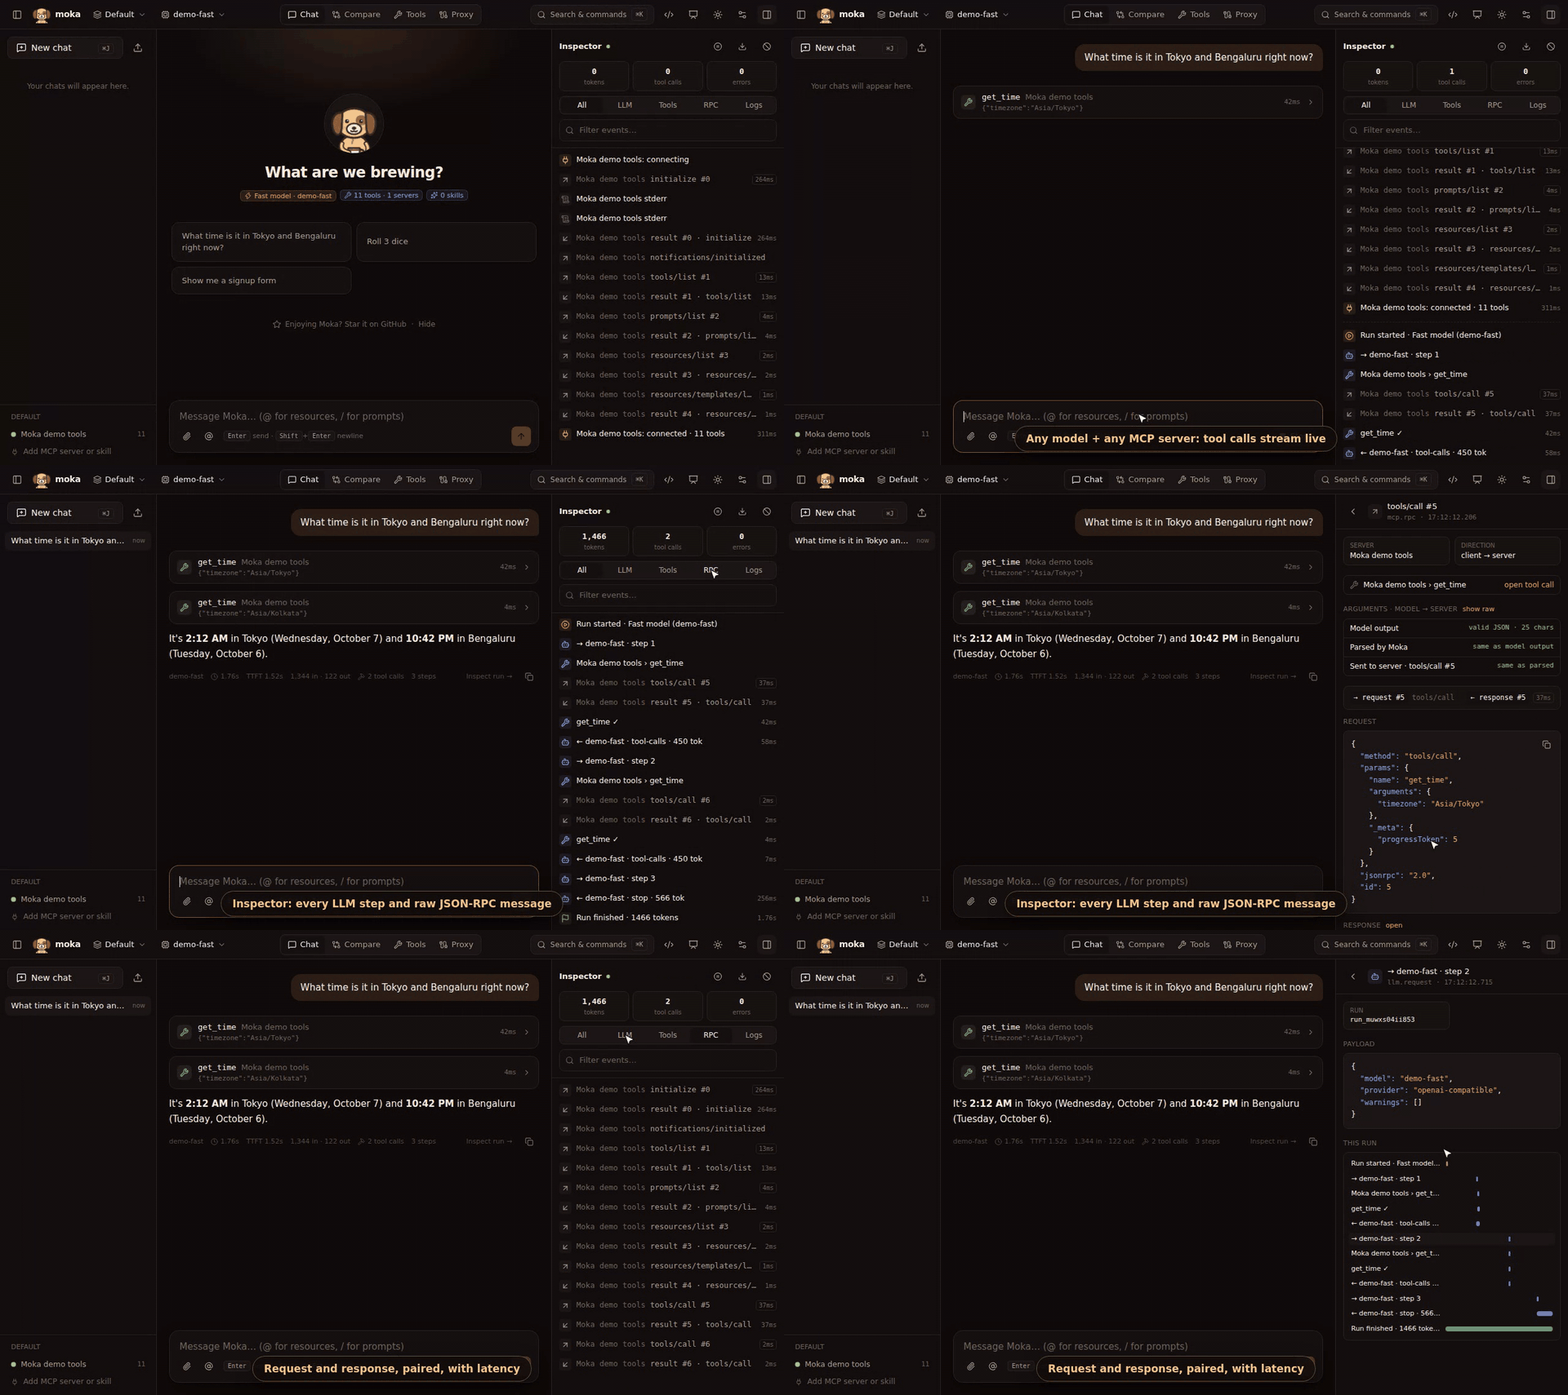
The inspector (right panel, ⌘ I) streams everything Moka does, live.
Filters
Section titled “Filters”| Tab | Shows |
|---|---|
| All | Everything |
| LLM | Run start/finish and every model request/response step |
| Tools | Tool calls, results, errors, skill loads, and generative UI traffic |
| RPC | Raw MCP JSON-RPC messages, both directions, including the initialize handshake, plus failed HTTP requests (mcp.http) and requests that never got an answer (mcp.unanswered) |
| Logs | Connection status changes, server stderr, warnings and errors |
Use the search box to filter by title or payload content (e.g. a tool argument value).
Event details
Section titled “Event details”Click any event to open it:
- Payload — the full JSON: request bodies sent to the provider, tool inputs and outputs, JSON-RPC messages, usage.
- This run — a waterfall of every step in the same run, so you can spot where time went (slow tool vs. slow model).
From a chat message, Inspect run → jumps straight to that run.
Requests and responses
Section titled “Requests and responses”Moka matches every JSON-RPC response to its request by id, in both directions (so a server’s own requests, like sampling or elicitation, pair up too). Each request in the list shows what happened to it:
| Badge | Meaning |
|---|---|
17ms | The response arrived after 17 ms |
error · 17ms | The server answered with a JSON-RPC error |
timed out · 60.0s | Moka gave up waiting (the server’s tool timeout) |
cancelled | Moka sent notifications/cancelled (for example, you stopped the run) |
cancelled · late reply | …and the server answered anyway, after the client had stopped listening |
no response | The connection closed while the request was still open |
waiting… | Still open |
Click a request or response to see both payloads with their ids side by side, plus any cancellation or “no response” marker. Responses are titled after their request (result #5 · tools/call), so the list reads naturally.
Retries and repeated writes
Section titled “Retries and repeated writes”When the model calls the same MCP tool again with the same arguments in one turn, Moka treats it as another attempt of the same call rather than a new one. Attempts share a lineage, matched by a fingerprint of the server, the tool, the tool’s input schema and the normalized arguments (key order doesn’t matter; a changed schema starts a new lineage).
Each failed attempt gets an error class:
| Class | Meaning |
|---|---|
timeout | Moka stopped waiting (tool timeout). The server may still have done the work |
cancelled | The call was stopped (you pressed Stop) |
transport | The connection broke: the server crashed or disconnected, or an HTTP or network error |
protocol | The server answered with a JSON-RPC error |
tool | The tool ran and reported an error (isError) |
declined | You declined it in the approval prompt |
input | The model’s arguments didn’t match the schema |
For a tool that may change something (no readOnlyHint), timeout, cancelled and transport leave it unknown whether the write happened:
- The tool card shows outcome unknown, and the error says so in the inspector.
- The error the model receives says so too (“the tool may have run. Check whether it did before retrying”), so it doesn’t report a save as failed when it may have worked.
- If the model retries and the retry succeeds, both may have written: the card shows may have run twice, and the result is a warning.
- A plain repeat of a write that succeeded (or is still running) is flagged same call again. A retry after a clear error (
protocol,tool, …) isn’t a warning.
Read-only tools are never flagged; repeats just show attempt 2, attempt 3. Neither are tools marked idempotentHint (repeating them has no extra effect): their retries show attempt 2 (idempotent), and a timeout still says outcome unknown, but a successful retry isn’t flagged as running twice.
Click any attempt (or its raw tools/call) to see Attempts: every attempt in the lineage with its outcome, duration and request id, linked to the RPC log. The trace download has the same data: lineage (id, attempt, fingerprint), errorClass and outcomeUnknown on tool events, and rpc.callId on the raw messages.
Arguments: model → server
Section titled “Arguments: model → server”Open a tool call (or its raw tools/call) to see its arguments at each hop:
| Row | What it checks |
|---|---|
| Model output | The arguments exactly as the model streamed them. “not valid JSON · truncated?” when the model’s output was cut off or malformed (the call fails with error class input, and nothing is sent) |
| Parsed by Moka | What Moka made of them, with any differences listed by path |
| Sent to server | The arguments in the tools/call request the server received, compared with the parsed ones |
show raw shows the model’s raw text. Truncated arguments and rewritten tool calls are much easier to spot here than in the chat.
Agent graphs
Section titled “Agent graphs”For AG-UI agents, events are nested under the step (graph node) that emitted them: tool calls, state deltas and messages sit under STEP_STARTED · <node>, and STEP_FINISHED shows how long the node took. See Remote agents.
Counters
Section titled “Counters”The header totals tokens, tool calls and errors since the inspector was last cleared.
Pause, clear, download
Section titled “Pause, clear, download”- Pause freezes the list while new events keep buffering.
- Clear wipes the server-side buffer (the last 2,000 events are kept by default).
- Download trace saves all events as JSON — handy for bug reports and for diffing runs.
See the event reference for every event kind and its payload.